


README activity
Embed a commit chart in your GitHub README to show visitors that the project is actively maintained.
Enter a public GitHub repository. GitStock turns its latest 100 commits into an interactive activity chart so you can inspect change intensity, replay the timeline, and share the result.
Example projects
Use GitStock wherever a clear picture of repository activity tells the story better than a commit list.
Embed a commit chart in your GitHub README to show visitors that the project is actively maintained.
Export an animated commit timeline to tell your project's development story on short-form video platforms.
Add a visual activity timeline to weekly updates, sprint reviews, and release retrospectives.
Share your development journey in a portfolio, blog post, presentation, or social update.
Check recent commit frequency and change size before choosing an open-source dependency.
Explore open-source projects that use GitStock to share their development activity.
DNSLog-GO is a monitoring tool written in Golang that monitors DNS resolution records. It comes with a web interface.
View on GitHub →A lightweight Windows framework for launching isolated AI desktop applications and CLI tools with independent profiles, workspaces, and environments.
View on GitHub →Fresh charts
Explore the latest public repositories added to GitStock.
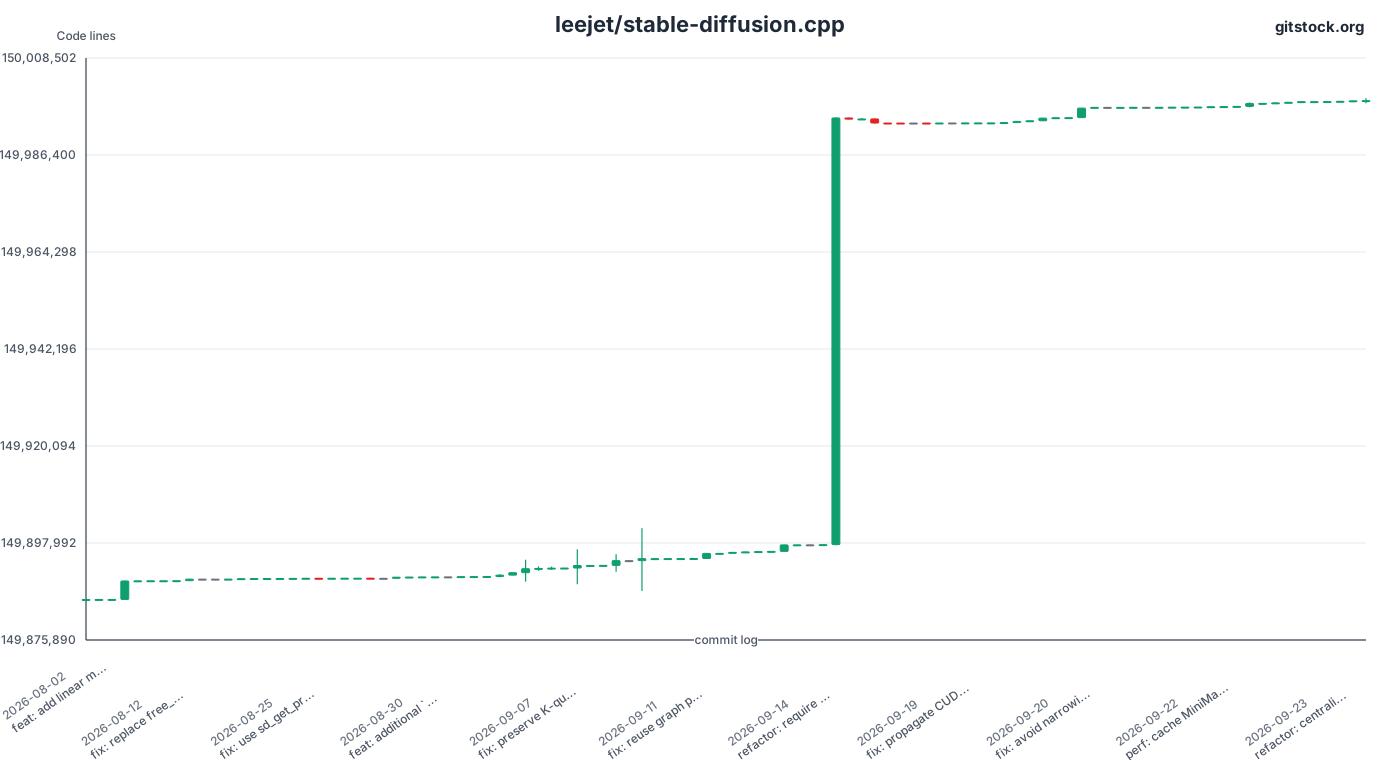
 leejet/stable-diffusion.cpp
View commit history →
leejet/stable-diffusion.cpp
View commit history →
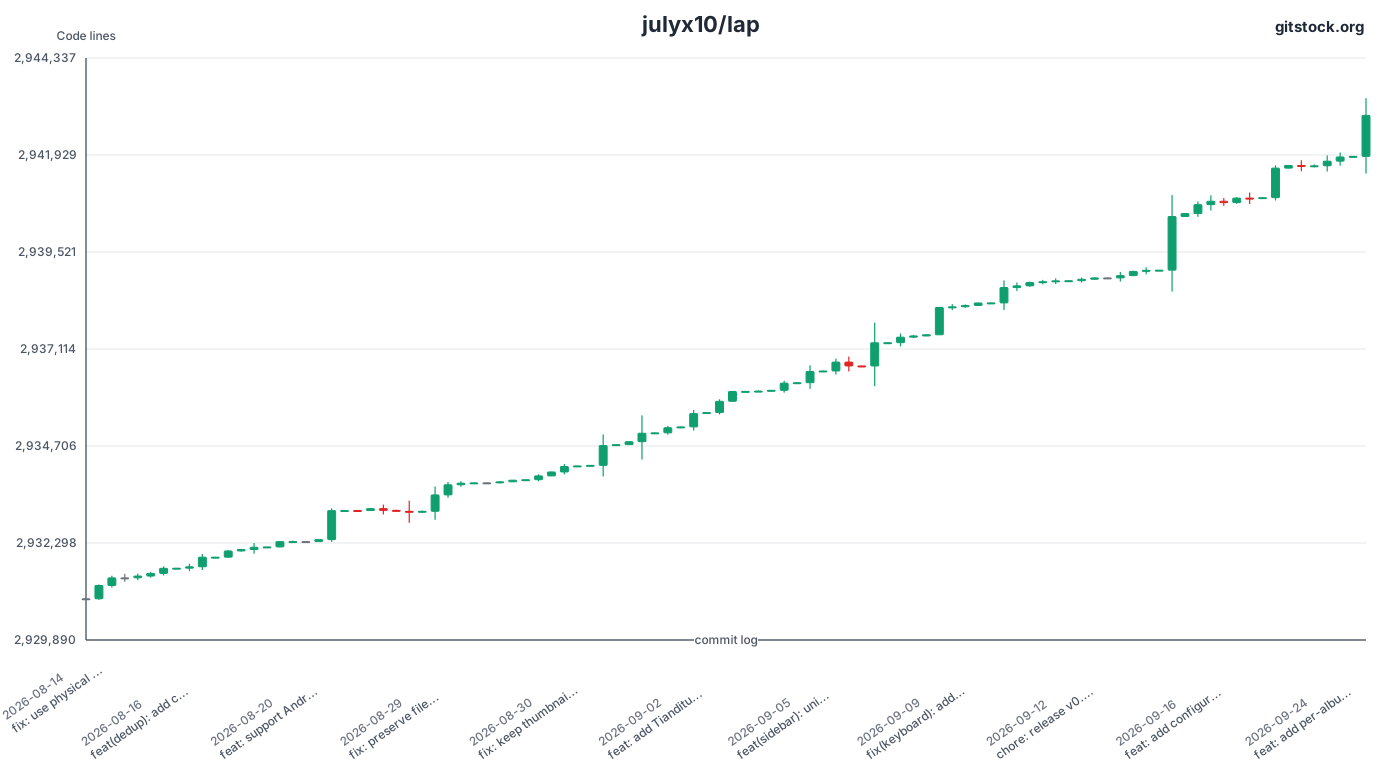
 julyx10/lap
View commit history →
julyx10/lap
View commit history →
 FxEmbed/FxEmbed
View commit history →
FxEmbed/FxEmbed
View commit history →
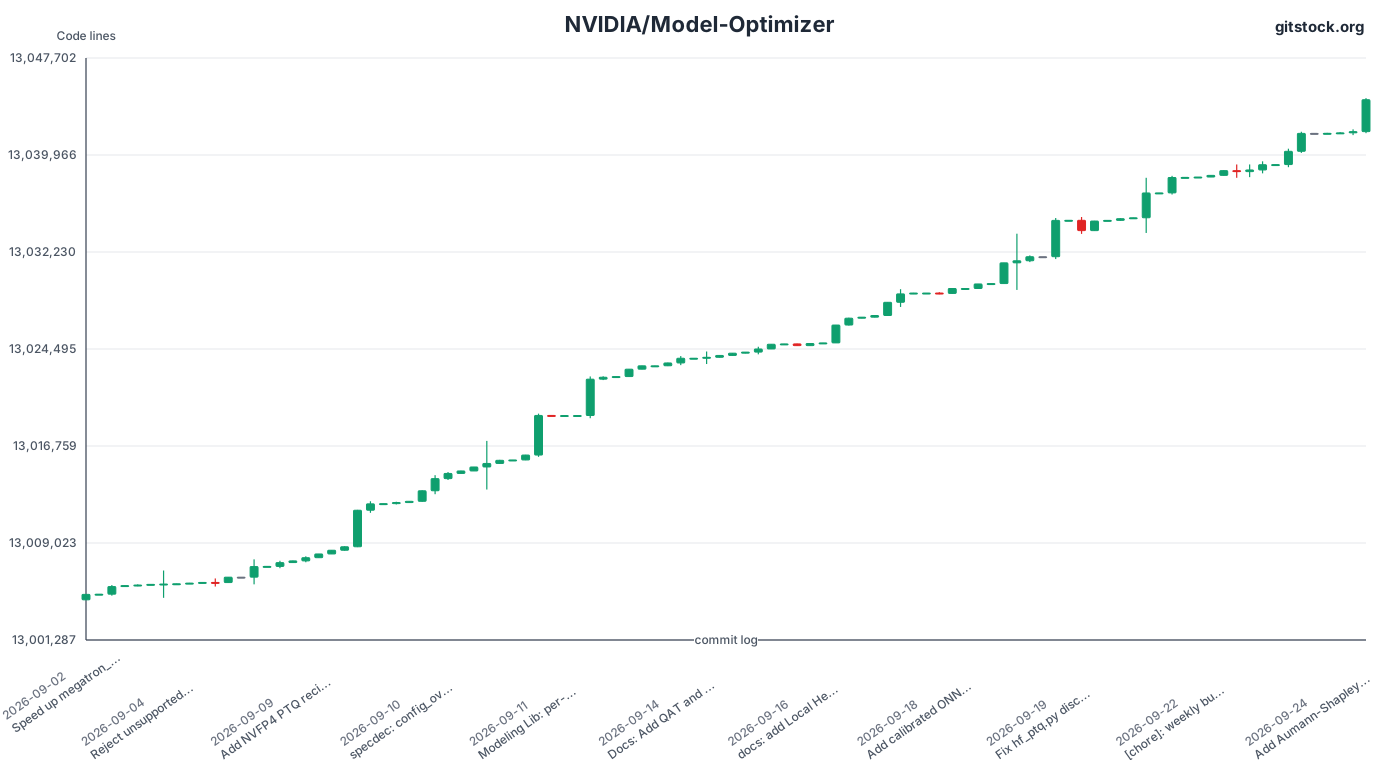
 NVIDIA/Model-Optimizer
View commit history →
NVIDIA/Model-Optimizer
View commit history →
 vectorize-io/hindsight
View commit history →
vectorize-io/hindsight
View commit history →
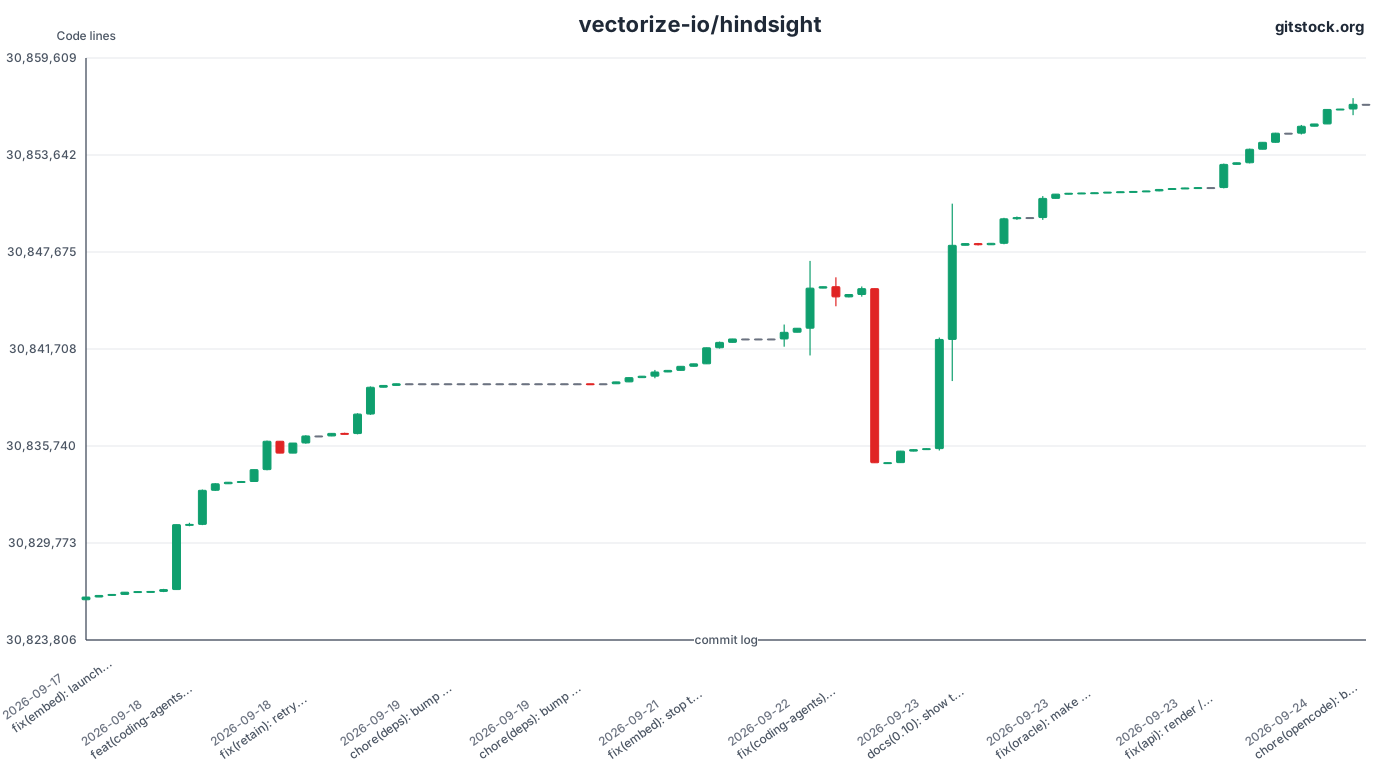 rohitg00/ai-engineering-from-scratch
View commit history →
rohitg00/ai-engineering-from-scratch
View commit history →
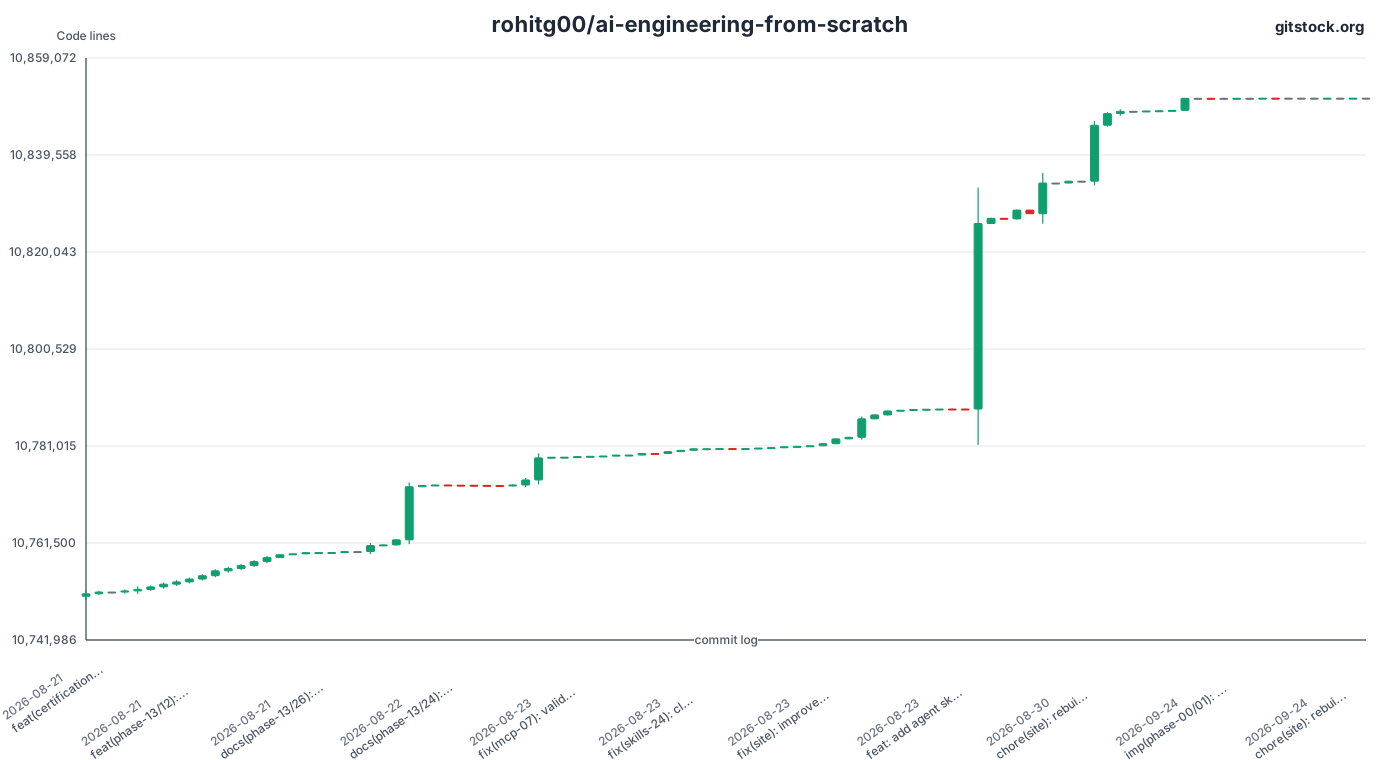 rjbicera/capstone-career-ready-application
View commit history →
rjbicera/capstone-career-ready-application
View commit history →
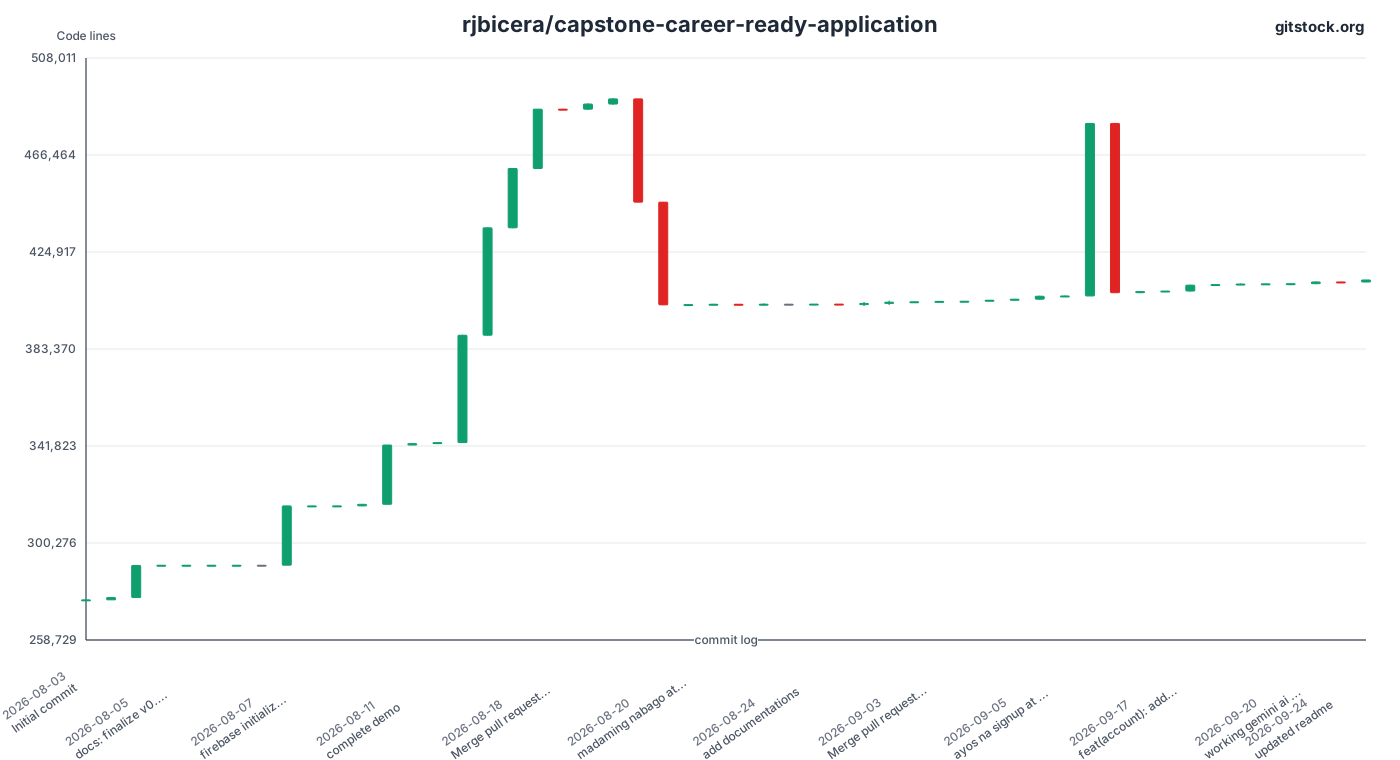
Built around commit data
GitStock gives a repository's recent git commit history a visual shape while keeping the details developers need close at hand.
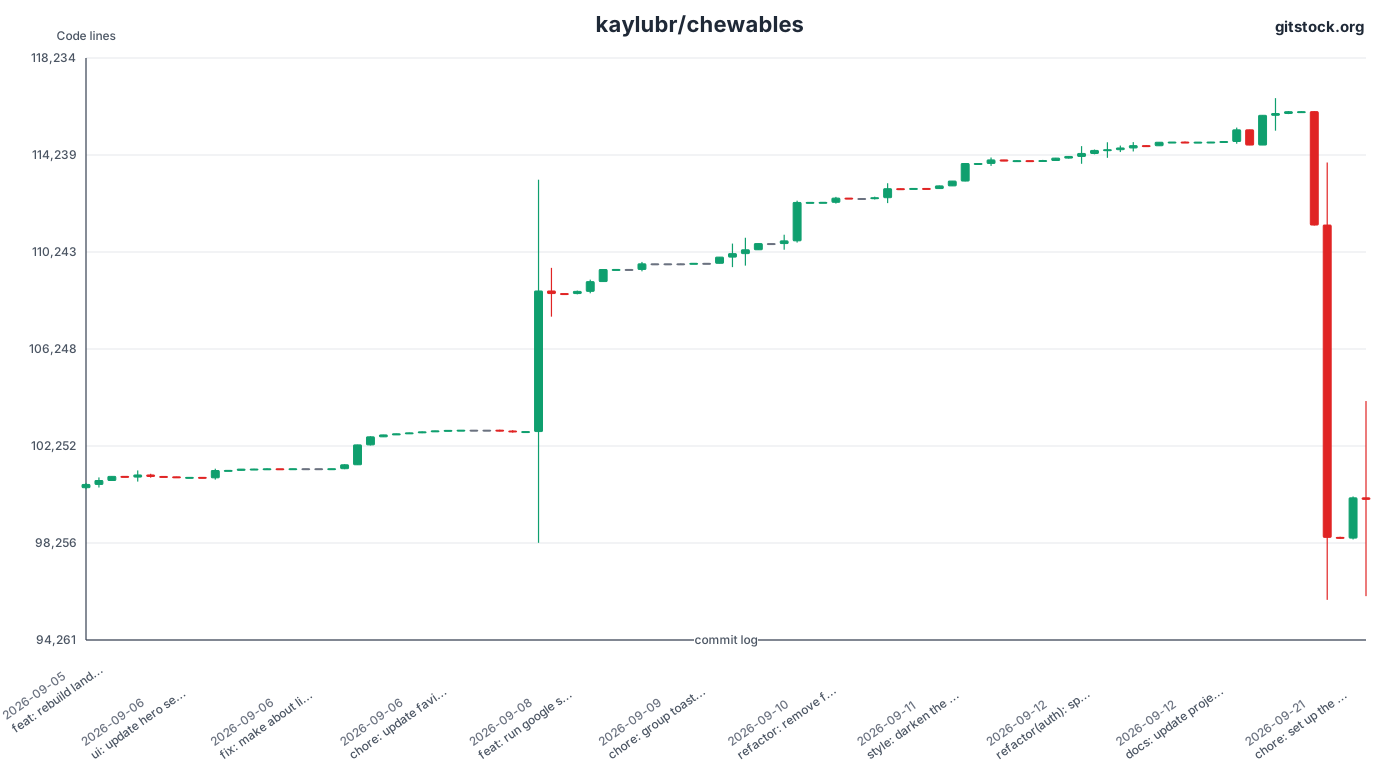
Read the latest 100 commits on the default branch from left to right. Hover a candle to inspect its short hash, message, additions, and deletions.
See large additions, deletions, and quieter periods without scanning a long GitHub commit list. Each candle represents one commit.
Copy the chart as an image or direct SVG URL, generate HTML and Markdown embeds, or turn the animated history into an MP4 video.
Three steps
Paste a GitHub URL or enter the repository as owner/repository.
Move across the timeline and hover individual commits to see their code-change details.
Adjust the animation speed, export a video, or embed the live SVG in documentation.
FAQ
It shows up to the latest 100 commits from a public repository's default branch. Each commit includes its short hash, message, additions, and deletions.
Each candle is one commit. Its tooltip exposes the before-and-after values together with additions and deletions, making unusually large changes easy to identify.
No. GitStock accepts public GitHub repositories and does not ask you to connect a GitHub account.
Yes. Open a repository chart and use Copy MD for Markdown, Copy HTML for websites, or Copy image URL for a direct SVG link.