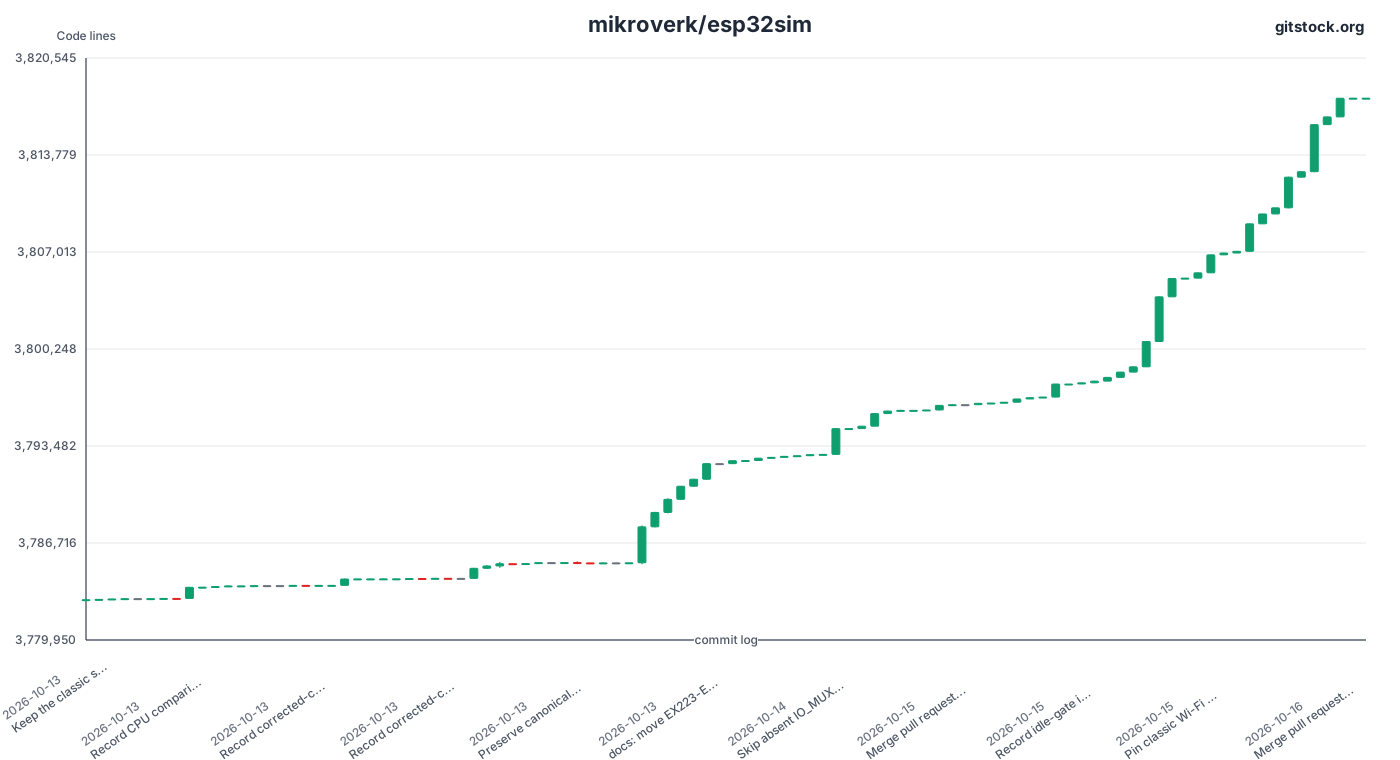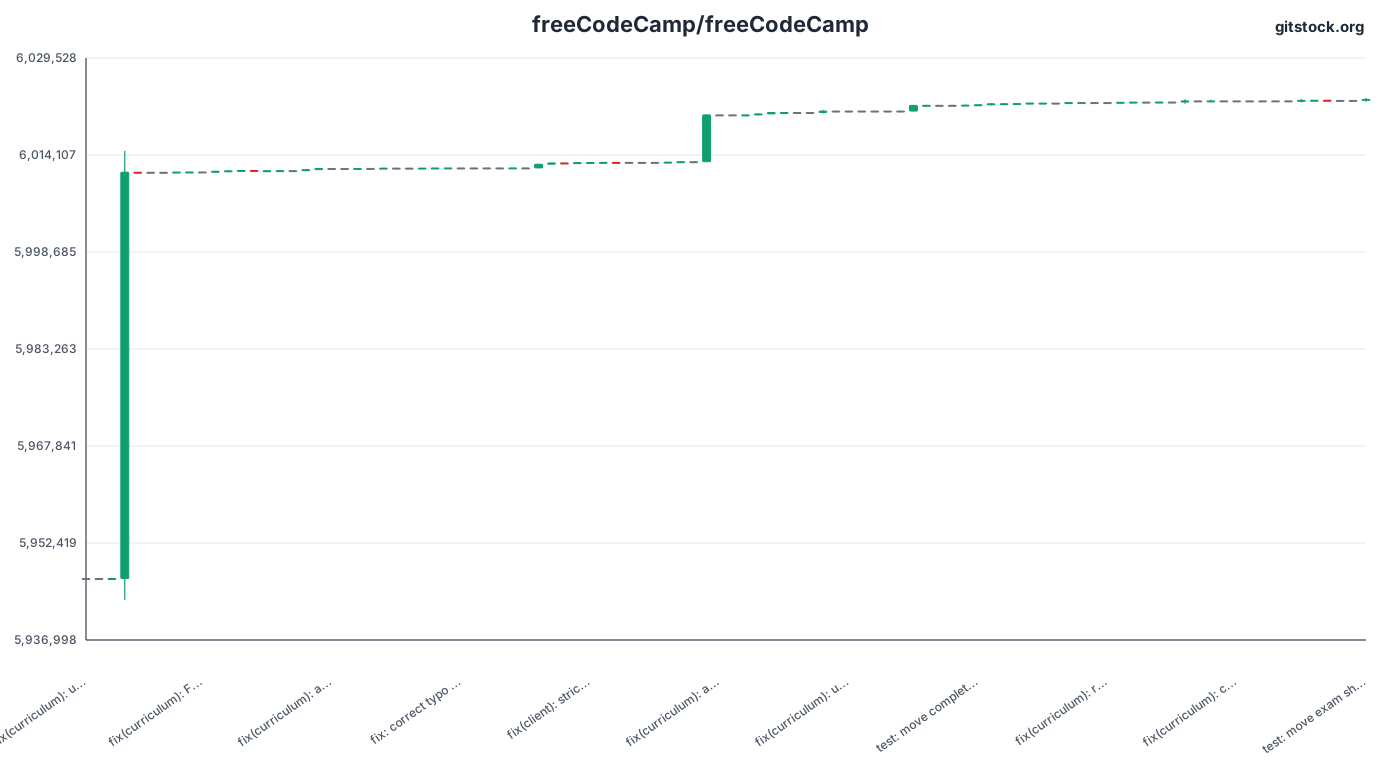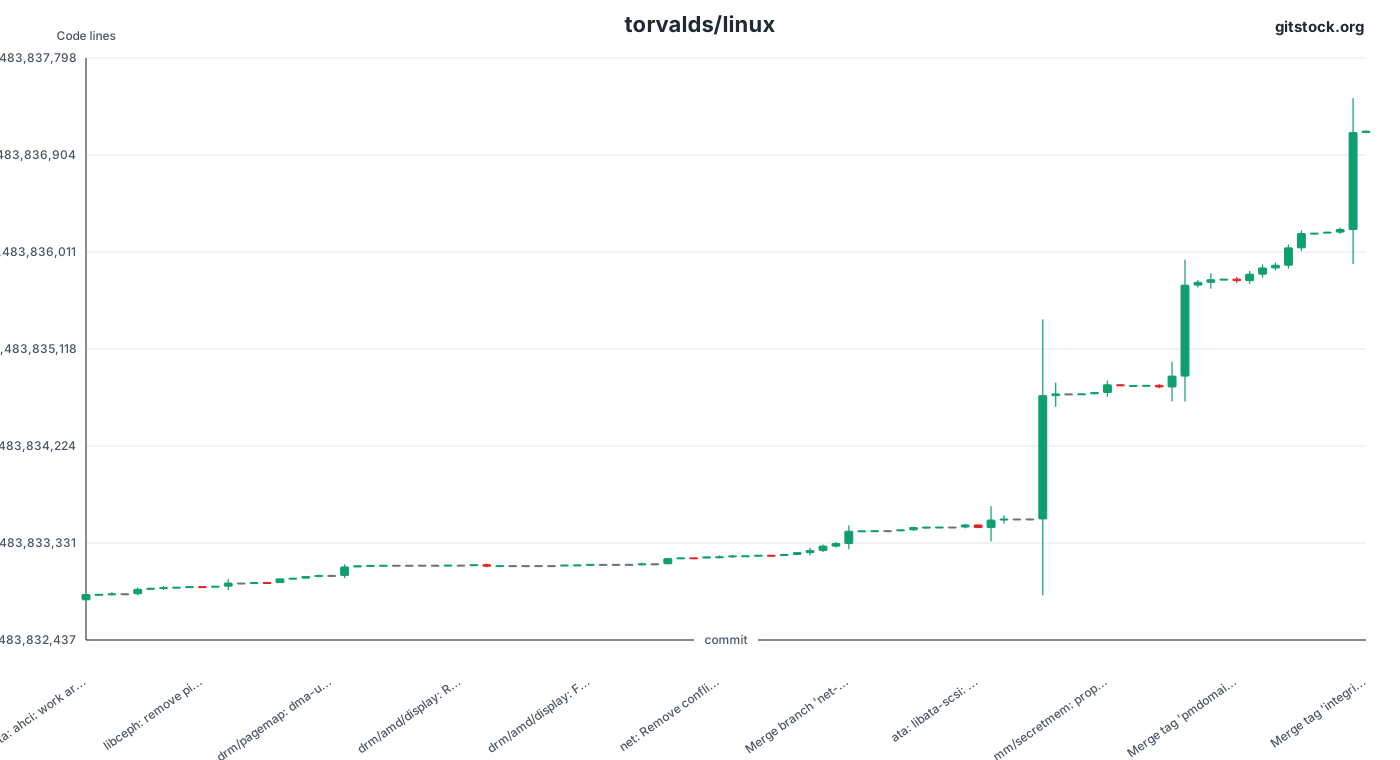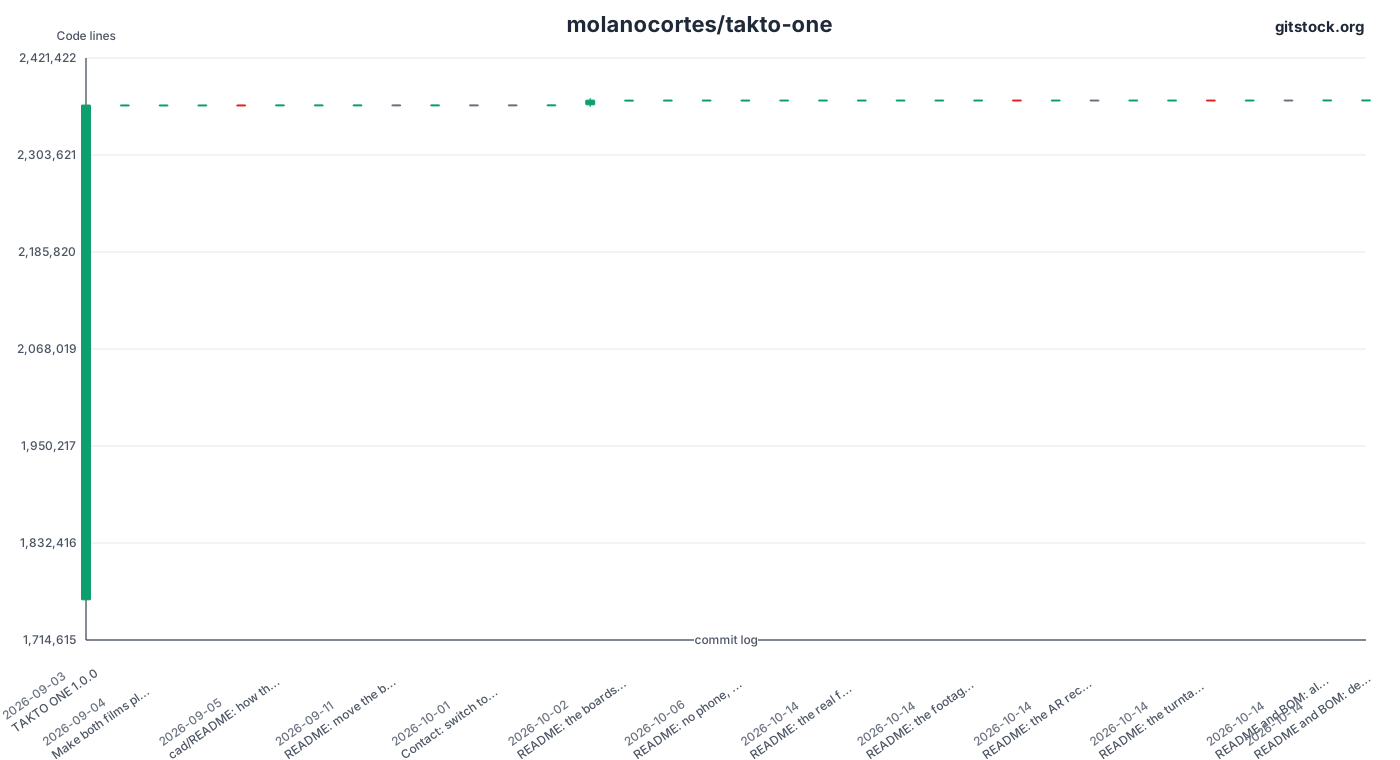
Kapendev/parin Commit History
chart updated:UTC 2026-10-16 21:14
About this Kapendev/parin commit history chart
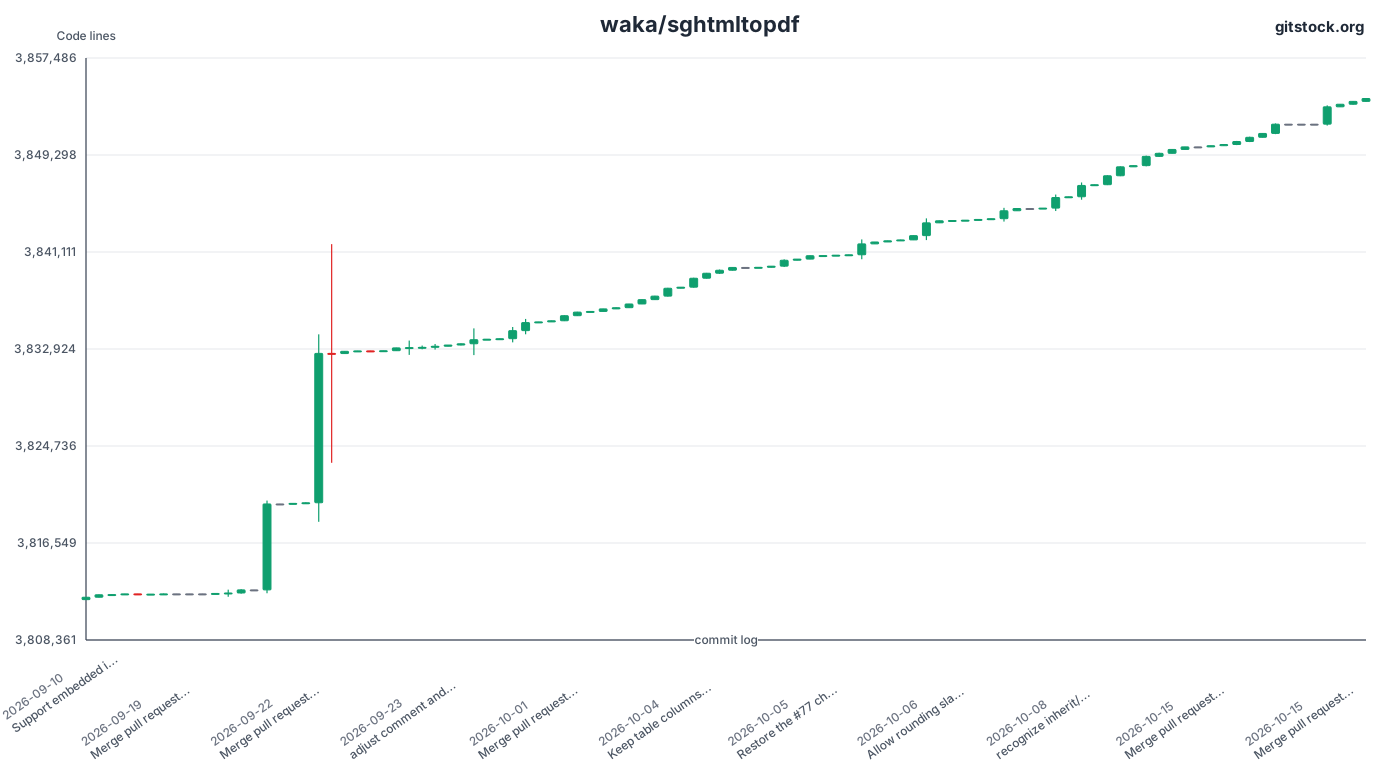
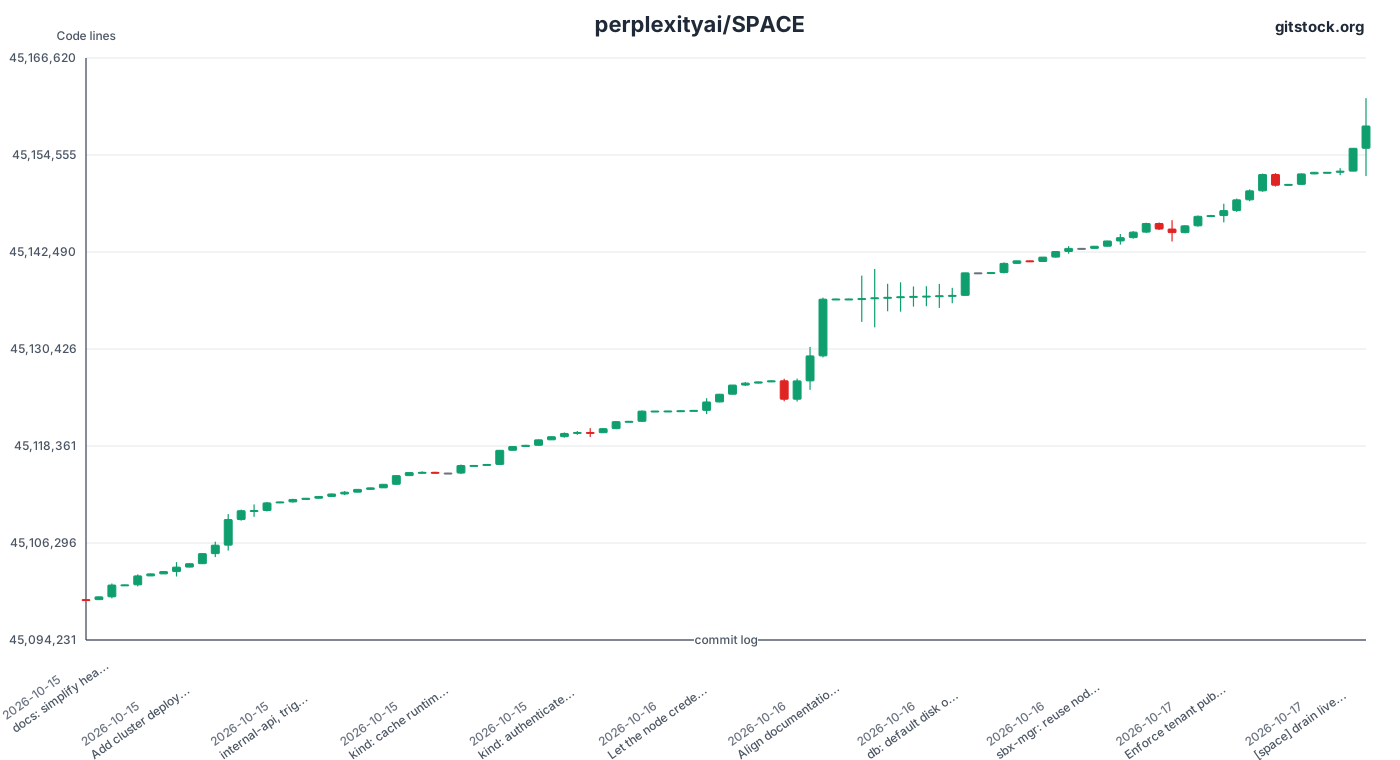
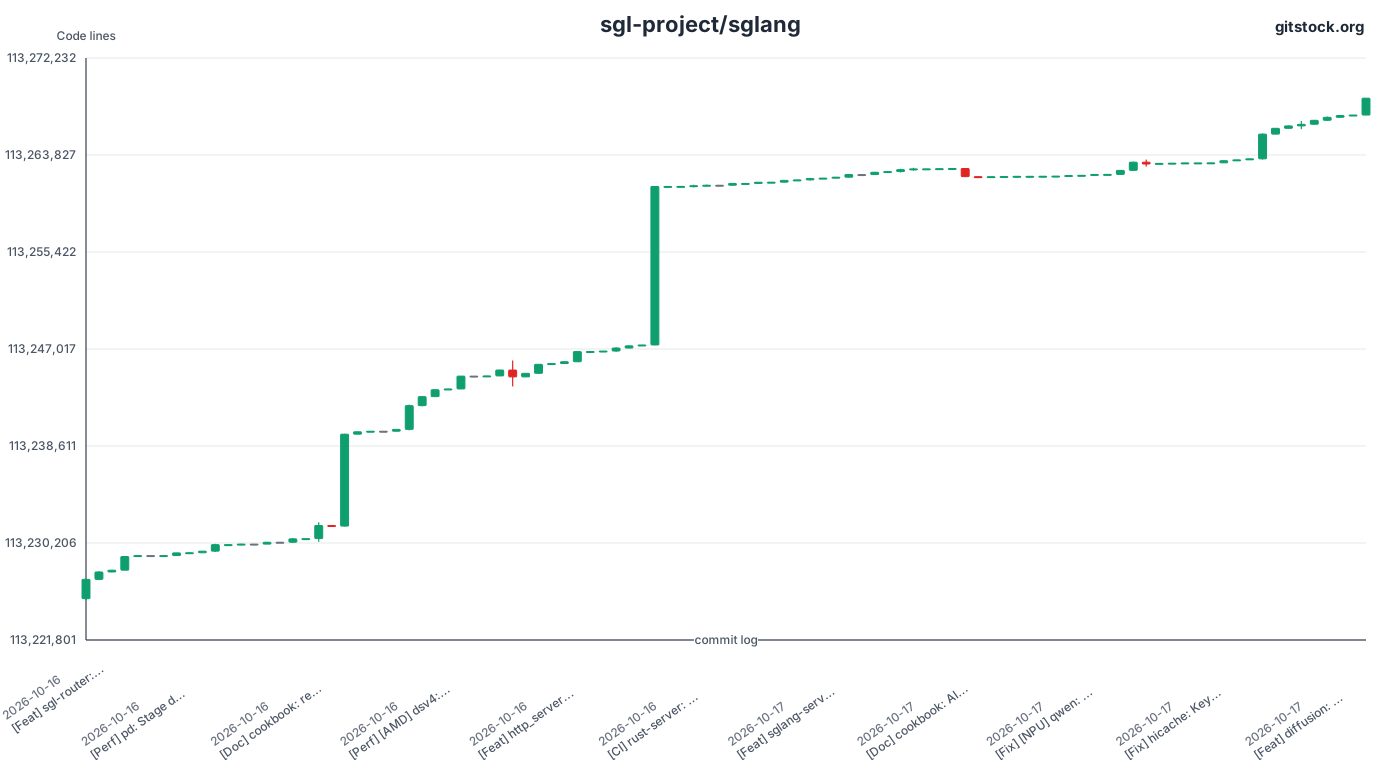
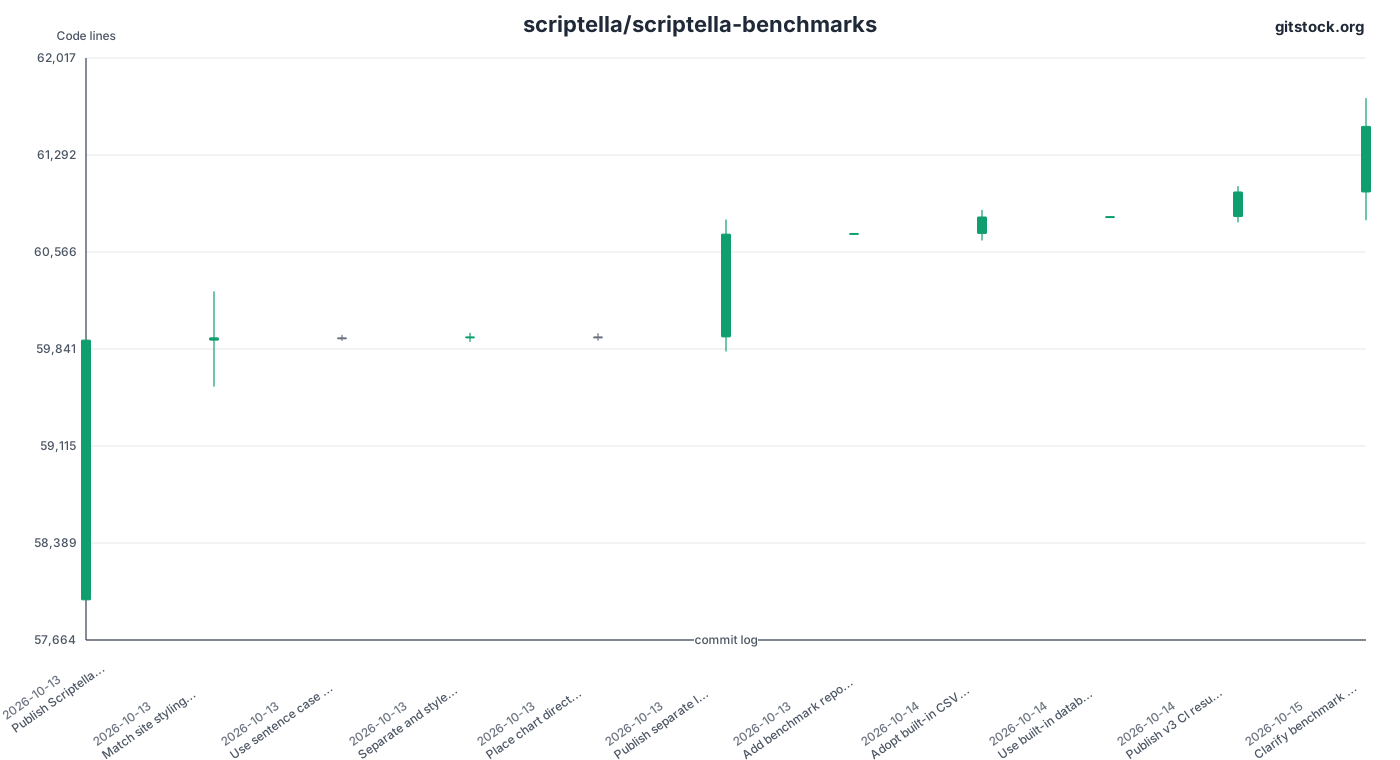
GitStock converts recent commits from the repository's default branch into a left-to-right K-line style timeline. It is designed to make the rhythm and size of code changes easier to scan than a flat commit list.
- Each candle represents one commit from the latest available history.
- Hover the chart to read the short commit hash, message, additions, and deletions.
- Replay the timeline, export it as video, or copy an image, direct SVG URL, HTML embed, or Markdown embed.